25% of global emissions come from food.
25%
of global emissions is due to food production. This surprises
everyone I’ve talked with since starting this project. The
carbon footprint
of what we eat surpasses transportation (19%) and
shelter (17%).
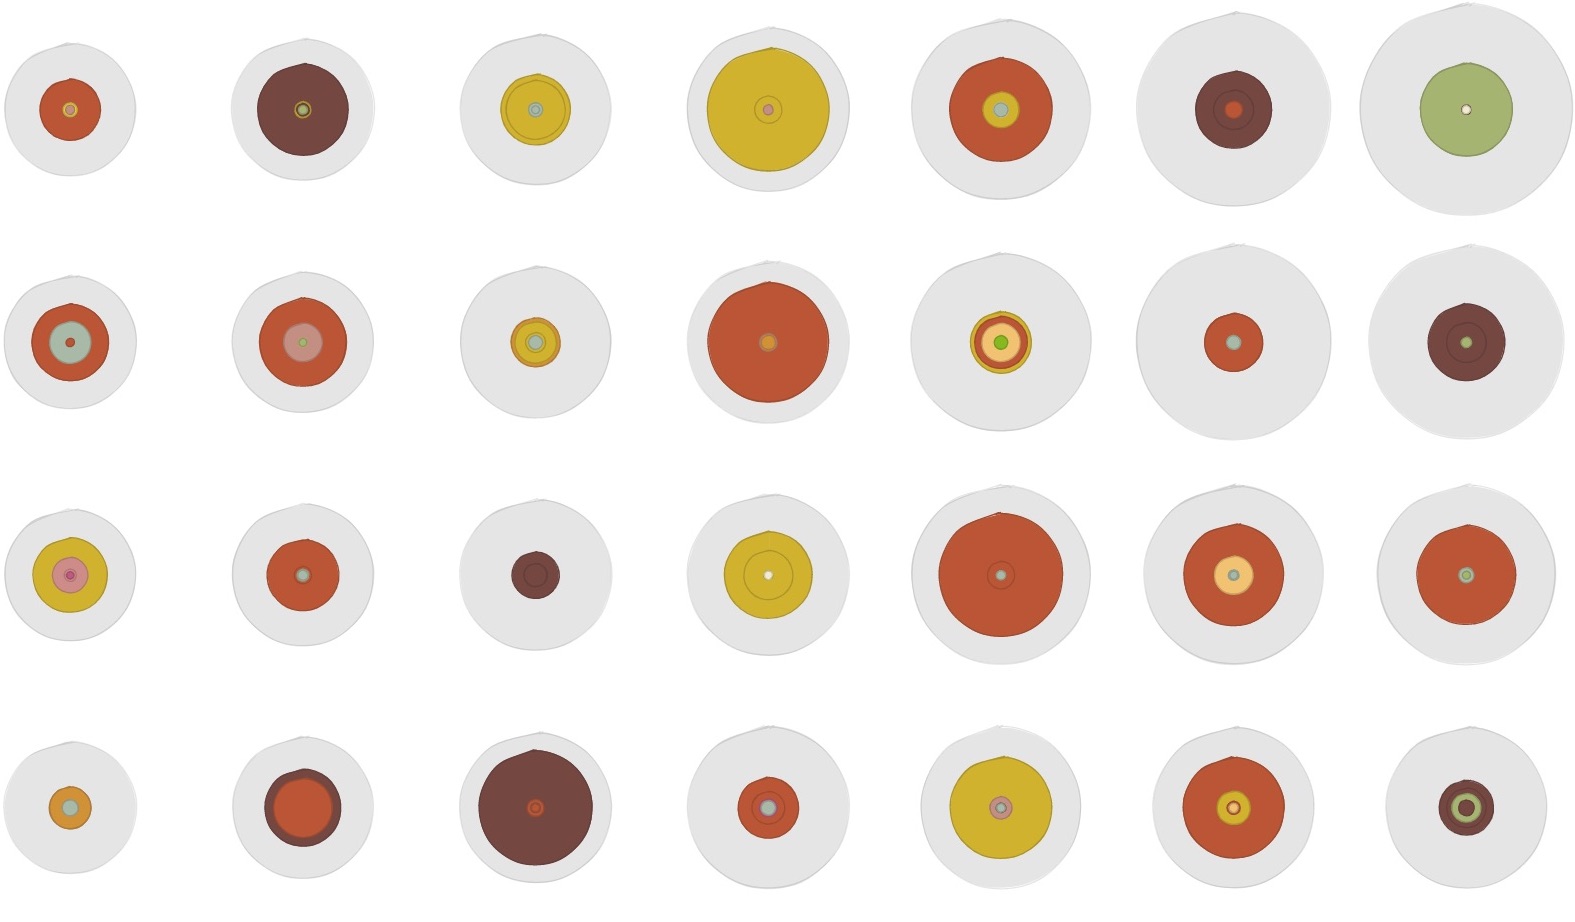
“ART TRANSFORMS DATA”
We know calorie counts, which foods are high carb, even gluten
free… but we really don’t have a clue about the carbon footprint
for individual foods. Can art be the way to expose the huge
disparity between foods?
Based on US, UK and France data*
Very little work has been done with individual diets and so I was delighted to
find Diego Rose and Martin Heller,
researchers at Tulane University and University of Michigan who have spent
the past several years linking carbon footprint of actual foods
consumed with USDA food categories in the “What We Eat In America”
food survey, and gave me access to their US data prior to publication.
Thank you. Also to open data
from Individual and National Study on Food
consumption for France and the Ademe Resource Center for
Greenhouse gas accounting. And to UK Data Service
who granted access to the
National Diet and Nutrition Survey, along with the
research paper
from Peter Scarborough, etal, University of Oxford.
*Data Source from USDA, UK Data Centre, Datagouv.fr
Fish, chicken, eggs, tofu
Nutritional shakes, misc.
The data collected from the three countries had only male and female as gender options.
We hope that they will add further gender options for participants in upcoming surveys.
“What We Eat” was created by data artist,
Laurie Frick in
Austin, Texas and Ashin Mandal, Benjamin Brachert,
Florian Dusch and Siniz Kim of
zigzag, a multidisciplinary
design company in Stuttgart, Germany.

Laurie Frick
Privacy & terms


 Copy Link
 Download Image